2019 List of graphics cards and graphics hierarchies
Graphics card comparison and rating list
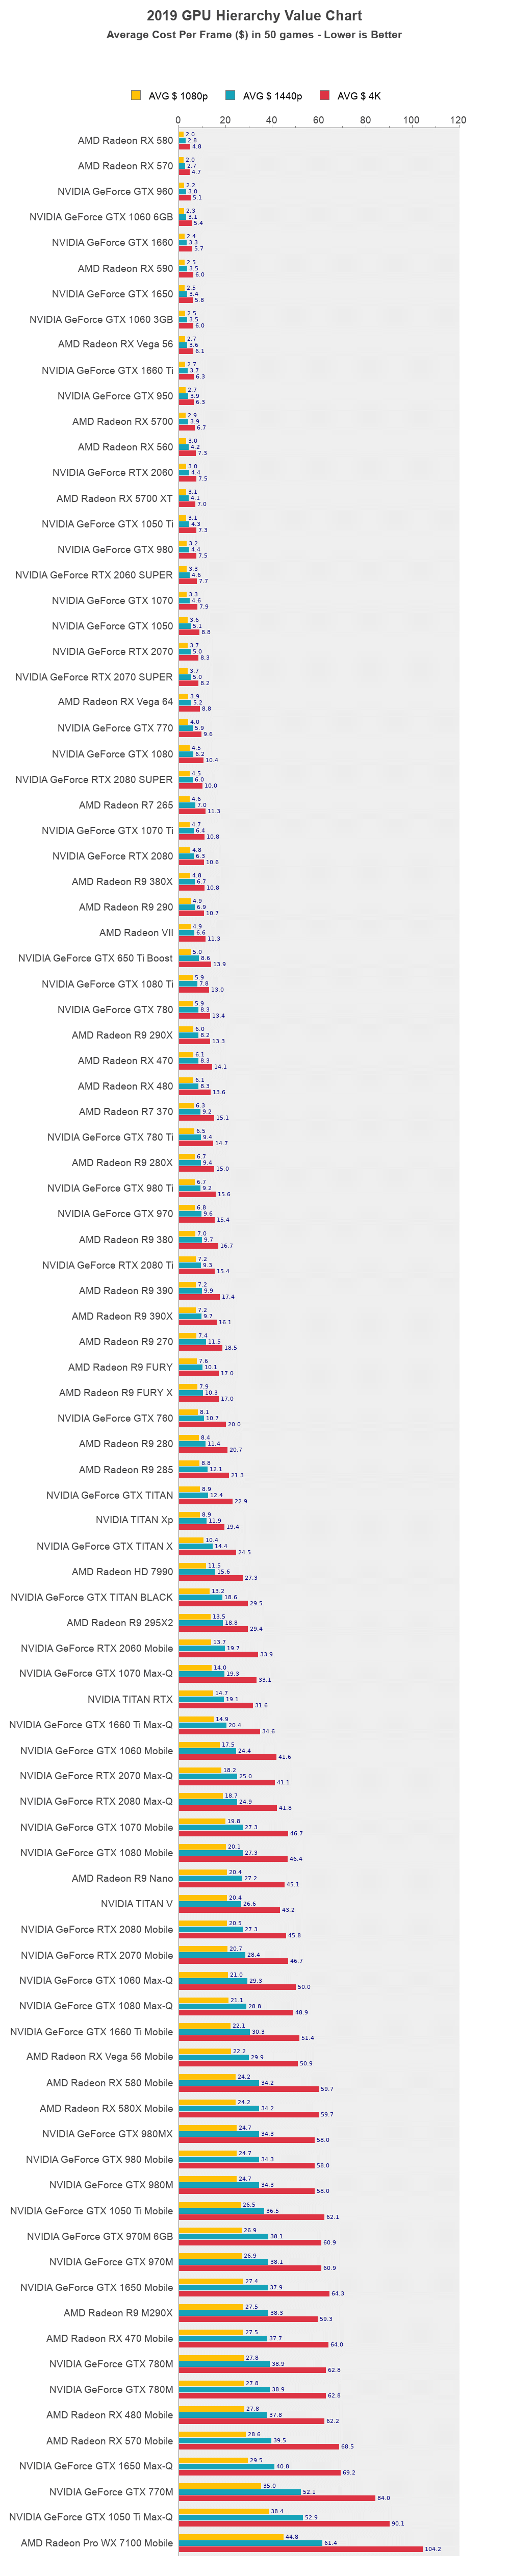
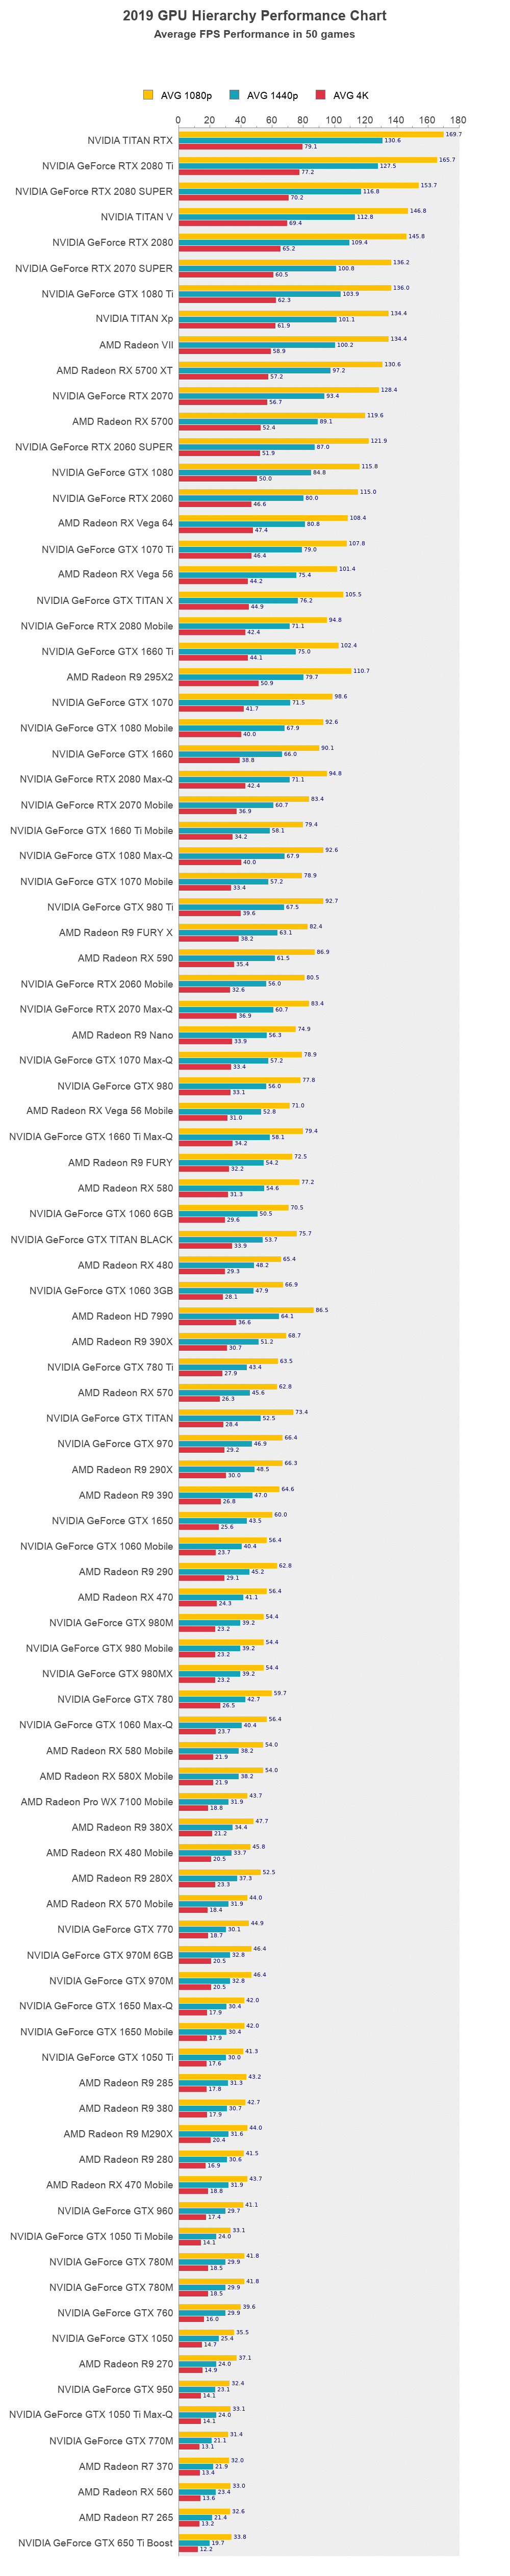
In this table we compare all graphics cards from best to worst. This list is a collection of almost every graphics card released in the last ten years. We have developed a graphics card hierarchy performance list as a comparison list of graphics cards, which is first sorted by the best graphics cards from well-known manufacturers, NVIDIA and AMD. The main indicator is the average score - the FPS (Frames per seconds) value in the 3 main game resolutions (1080p - FULL HD, 144p and 4K).
How do we rate these graphics cards?
Real gaming tests are used to evaluate these graphics cards. We always look for performance in frames per second - FPS and not in TFLOPS or GB / s or other theoretical values that do not make sense to gamers. Our test results correspond to the average FPS value in the default resolution of the game file vs the highest detail settings of the quality of the tested game. In addition to our own tests, values from various graphics card test sources including TechPowerUp, TomsHardware, AnandTech, TechSpot and many others were also projected into the resulting value.
By clicking on a graphics card, you will get a list of all game builds that have this graphics card.
| Skirt | Grafic card | Index | 1080p FPS resolution | 1440p FPS resolution | 4K FPS resolution | |
|---|---|---|---|---|---|---|
| 2018 | TITAN-RTX | |||||
| 2018 | RTX 2080 Ti | |||||
| 2019 | RTX 2080 SUPER | |||||
| 2017 | TITAN V | |||||
| 2018 | RTX 2080 | |||||
| 2019 | RTX 2070 SUPER | |||||
| 2017 | 1080 GTX Ti | |||||
| 2017 | TITAN XP | |||||
| 2019 | Radeon VII | |||||
| 2019 | RX 5700 XT | |||||
| 2018 | RTX 2070 | |||||
| 2019 | RX 5700 | |||||
| 2019 | RTX 2060 SUPER | |||||
| 2016 | GTX 1080 | |||||
| 2019 | RTX 2060 | |||||
| 2017 | RX Vega 64 | |||||
| 2017 | 1070 GTX Ti | |||||
| 2017 | RX Vega 56 | |||||
| 2015 | GTX TITAN | |||||
| 2019 | RTX 2080 Mobile | |||||
| 2019 | 1660 GTX Ti | |||||
| 2014 | R9 295X2 | |||||
| 2016 | GTX 1070 | |||||
| 2016 | GTX 1080 Mobile | |||||
| 2019 | GTX 1660 | |||||
| 2019 | RTX 2080 Max-Q | |||||
| 2019 | RTX 2070 Mobile | |||||
| 2019 | GTX 1660 Ti Mobile | |||||
| 2017 | GTX 1080 Max-Q | |||||
| 2016 | GTX 1070 Mobile | |||||
| 2015 | 980 GTX Ti | |||||
| 2015 | R9 FURY X | |||||
| 2018 | RX 590 | |||||
| 2019 | RTX 2060 Mobile | |||||
| 2019 | RTX 2070 Max-Q | |||||
| 2015 | R9 Nano | |||||
| 2017 | GTX 1070 Max-Q | |||||
| 2014 | GTX 980 | |||||
| 2018 | RX Vega 56 Mobile | |||||
| 2019 | GTX 1660 Ti Max-Q | |||||
| 2015 | R9 FURY | |||||
| 2017 | RX 580 | |||||
| 2016 | GTX 1060 6GB | |||||
| 2014 | GTX TITAN BLACK | |||||
| 2016 | RX 480 | |||||
| 2016 | GTX 1060 3GB | |||||
| 2013 | HD 7990 | |||||
| 2015 | R9 390X | |||||
| 2013 | 780 GTX Ti | |||||
| 2017 | RX 570 | |||||
| 2013 | GTX TITAN | |||||
| 2014 | GTX 970 | |||||
| 2013 | R9 290X | |||||
| 2015 | R9 390 | |||||
| 2019 | GTX 1650 | |||||
| 2016 | GTX 1060 Mobile | |||||
| 2013 | R9 290 | |||||
| 2016 | RX 470 | |||||
| 2014 | GTX 980M | |||||
| 2015 | GTX 980 Mobile | |||||
| 2016 | GTX 980MX | |||||
| 2013 | GTX 780 | |||||
| 2017 | GTX 1060 Max-Q | |||||
| 2017 | RX 580 Mobile | |||||
| 2018 | RX 580X Mobile | |||||
| 2017 | For WX 7100 Mobile | |||||
| 2015 | R9 380X | |||||
| 2016 | RX 480 Mobile | |||||
| 2013 | R9 280X | |||||
| 2017 | RX 570 Mobile | |||||
| 2013 | GTX 770 | |||||
| 2014 | GTX 970M 6GB | |||||
| 2014 | GTX 970M | |||||
| 2019 | GTX 1650 Max-Q | |||||
| 2019 | GTX 1650 Mobile | |||||
| 2016 | 1050 GTX Ti | |||||
| 2014 | R9 285 | |||||
| 2015 | R9 380 | |||||
| 2014 | R9 M290X | |||||
| 2014 | R9 280 | |||||
| 2016 | RX 470 Mobile | |||||
| 2015 | GTX 960 | |||||
| 2017 | GTX 1050 Ti Mobile | |||||
| 2013 | GTX 780M | |||||
| 2013 | GTX 780M | |||||
| 2013 | GTX 760 | |||||
| 2018 | GTX 1050 | |||||
| 2013 | R9 270 | |||||
| 2015 | GTX 950 | |||||
| 2018 | GTX 1050 Ti Max-Q | |||||
| 2013 | GTX 770M | |||||
| 2015 | R7 370 | |||||
| 2017 | RX 560 | |||||
| 2014 | R7 265 | |||||
| 2013 | GTX 650 Ti Boost |